Synergy Codes is a leading data visualization agency that helps SaaS companies enhance software performance and usability through custom-built BI and analytics solutions. With over 12 years of experience and 170+ successful projects, the company specializes in complex diagram development, graph databases, React Flow and GoJS consulting, and UI/UX design. Backed by a team of 70+ experts and trusted by Fortune 500 clients, Synergy Codes delivers innovative, fast, and scalable data-driven solutions recognized for their quality, speed, and design excellence.
Interview with Maciej Teska, CEO & Founder of Synergy Codes.
A brief description of Synergy Codes and its activities
Maciej Teska: At Synergy Codes, we’ve positioned ourselves as pioneers in solving one of engineering’s most persistent challenges: the time-intensive, error-prone manual processes that still plague technical drawing creation and management. We’re a software consultancy firm specializing in building tailored engineering and industrial solutions that automate engineering work through advanced visualization technologies.
What sets us apart is our proprietary technology stack combined with deep understanding of engineering workflows. We don’t just build software – we transform how engineering teams work by eliminating manual bottlenecks that have existed for decades. Our solutions help engineering firms reduce design cycles from weeks to days while ensuring unprecedented accuracy in technical documentation.
What are the main areas of activity of the company?
M.T: Our core activities revolve around building tailored software solutions based on our proprietary and partner technologies — perfectly suited for use in the engineering sector. We focus on three primary domains:
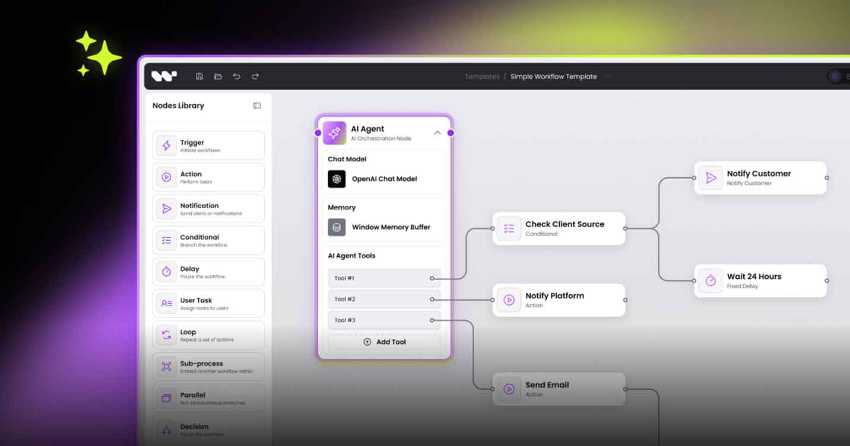
First, workflow automation where we create a complete front-end layer for workflows, pipelines, and automations. Second, data visualization platforms that transform complex engineering data into intuitive, actionable insights. Third, integration solutions that seamlessly connect existing engineering tools with modern visualization interfaces.
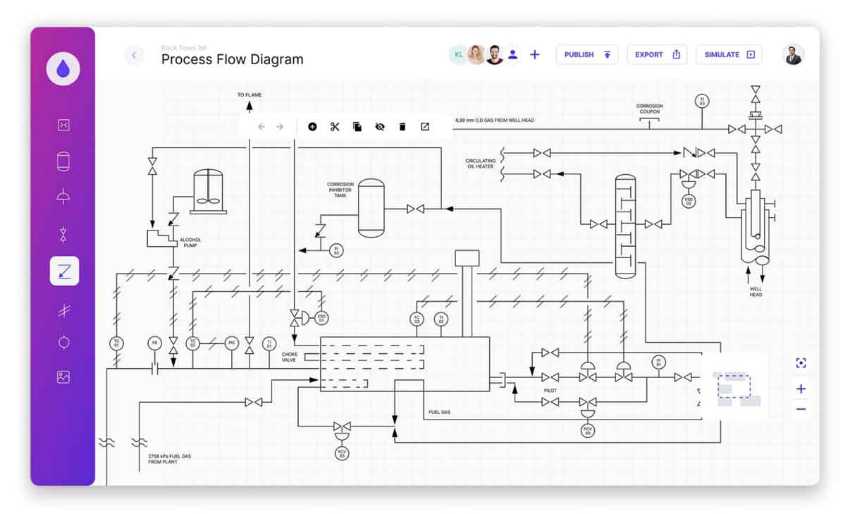
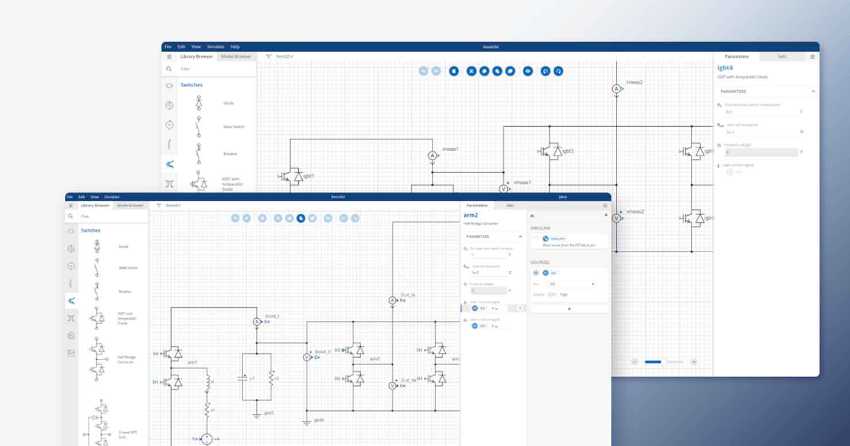
We’ve developed specialized expertise in creating diagramming solutions for Single Line Diagrams, SCADA systems, P&ID drawings, and Product Configurator tools. Our approach always starts with understanding the specific pain points engineering teams face – whether it’s creating consistent technical documentation, managing complex piping and instrumentation diagrams, or configuring custom industrial equipment.
What’s the news about new products/services?
M.T: I’m excited to share two breakthrough developments that we’ve recently launched. First, our Workflow Builder represents a complete paradigm shift in how automation interfaces are designed and deployed. It starts in Figma, where designers can prototype workflow interfaces, then seamlessly moves into React where developers transform those prototypes into production-ready editors. This technology is already helping companies in various industries build sophisticated automation platforms with unprecedented speed and precision.
Second, we’ve just released ngDiagram, an open-source technology specifically designed for Angular developers. This is particularly significant for the engineering community because it enables rapid development of any kind of diagramming solution – from Single Line Diagrams and SCADA interfaces to P&ID drawings and Schematic Designers.
These tools are already transforming how engineering firms approach automation, with some clients reporting up to 75% reduction in design cycle times while maintaining perfect compliance with industry standards.
What are the ranges of products/services?
M.T: Our service spectrum is comprehensive by design. When we approach a new client, we always start with a thorough Discovery & Audit phase. This involves comprehensive analysis of business challenges, technical requirements, and user needs through specialized workshops and expert-led evaluations. We dig deep into understanding not just what engineers are struggling with, but why existing solutions fall short.
Following discovery, we move into Product Strategy development, where we transform business requirements into actionable innovation plans and scalable product strategies. Our Design & UX phase employs user-centered design approaches, creating intuitive, accessible interfaces that transform complex engineering data into visual intelligence solutions.
Finally, our Enterprise Implementation delivers scalable, secure, high-performance solutions using leading technologies combined with our proprietary components for rapid delivery. We don’t just deliver software – we ensure seamless integration with existing systems, comprehensive training, and ongoing support to guarantee long-term success.
What is the state of the market where you are currently active?
M.T: The data visualization market is experiencing unprecedented growth, with market size expected to double within the next five years, representing a compound annual growth rate exceeding 10% Research and Markets. For the engineering sector specifically, we’re seeing even more dramatic expansion.
What’s particularly exciting is that Synergy Codes is positioned at the intersection of the highest-growth segments: AI integration and advanced visualization. The engineering industry is finally recognizing that data without proper visualization is just noise. Our solutions address this critical gap by transforming complex engineering data into actionable intelligence.
The industrial automation software market alone is projected to reach $59.71 billion by 2030, growing at a CAGR of 7.90% Mordor Intelligence. This growth is driven by engineering firms desperately seeking ways to modernize their workflows and improve efficiency while maintaining the precision their industries demand.
What can you tell us about market trends?
M.T: Several transformative trends are reshaping our market. The most significant is the convergence of AI with traditional engineering workflows. We’re moving beyond simple automation into intelligent systems that can predict design issues before they occur, suggest optimizations, and even generate alternative design approaches based on historical data and performance metrics.
Real-time collaboration has become essential, especially with distributed engineering teams becoming the norm. Our visualization platforms enable multiple engineers to work simultaneously on complex diagrams while maintaining version control and ensuring consistency across all documentation.
Sustainability-driven design is another critical trend. Engineering firms are under increasing pressure to optimize resource usage and reduce environmental impact. Our visualization tools help identify inefficiencies in designs that might otherwise go unnoticed, supporting the industry’s shift toward more sustainable practices.
The rise of edge computing and IoT integration means we’re seeing massive increases in data generation from industrial equipment. Without proper visualization tools, this data remains underutilized. Our solutions transform this data flood into actionable insights that drive better engineering decisions.
What are the most innovative products/services marketed?
M.T: Currently, our most innovative work centers on AI-powered engineering automation. We’re developing systems that don’t just automate repetitive tasks but actually learn from engineering decisions, building intelligence that improves over time. For example, our intelligent diagramming tools can now suggest optimal routing for electrical circuits or piping systems based on thousands of previous successful designs.
We’re also pioneering predictive visualization technologies that can simulate how changes in design will impact overall system performance before any physical modifications are made. This is particularly valuable in industries like power generation, oil and gas, and manufacturing where downtime costs can be astronomical.
Our generative design visualization represents another breakthrough area. Rather than engineers manually creating multiple design iterations, our systems can generate and visualize dozens of optimal alternatives based on specified constraints and objectives, dramatically accelerating the innovation cycle.
What estimations do you have for the second half of 2025?
M.T: Looking ahead to the second half of 2025, we’re anticipating significant acceleration in enterprise adoption of open-source solutions. Engineering firms are becoming more sophisticated in their technology choices, seeking vendors who can support comprehensive digital transformation rather than just point solutions.
The demand for software modernization is reaching critical mass. Many engineering companies are running legacy systems that simply cannot handle the data volumes and complexity requirements of modern projects. We expect a surge in migration projects as firms realize that clinging to outdated tools is no longer sustainable.
Data visualization acceleration will become a primary focus area. Engineering firms are accumulating vast amounts of data but struggling to extract meaningful insights. Our experience shows that properly visualized engineering data can reduce project timelines by 30-50% while improving accuracy and reducing costly errors.
The convergence of AI, visualization, and engineering automation will reach a tipping point. Companies that have been experimenting with these technologies in isolation will seek integrated solutions that deliver measurable ROI.